TOILET DATA
Results of Week One
We want to get to know the growing Campus Fryslan community better. Following the nature of our committee, we do so with the use of data. Every week, there is going to be a new poster with which you can tell us a bit about yourself! We are very curious to get to know each other in a quantitative way and share a bit about CF's population!
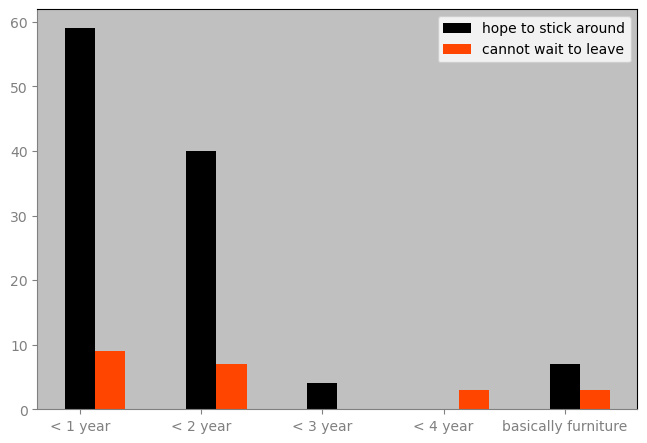
Week one was all about endurance! How long have you been part of the faculty? You can find the results in the small plot. It does not come as a huge surprise that most of us are not here for very long as we are a quickly growing faculty. At the same time, we are happy to hear that the overwhelming majority hopes to stay for a bit longer!
TOILET DATA
Results of Week Two
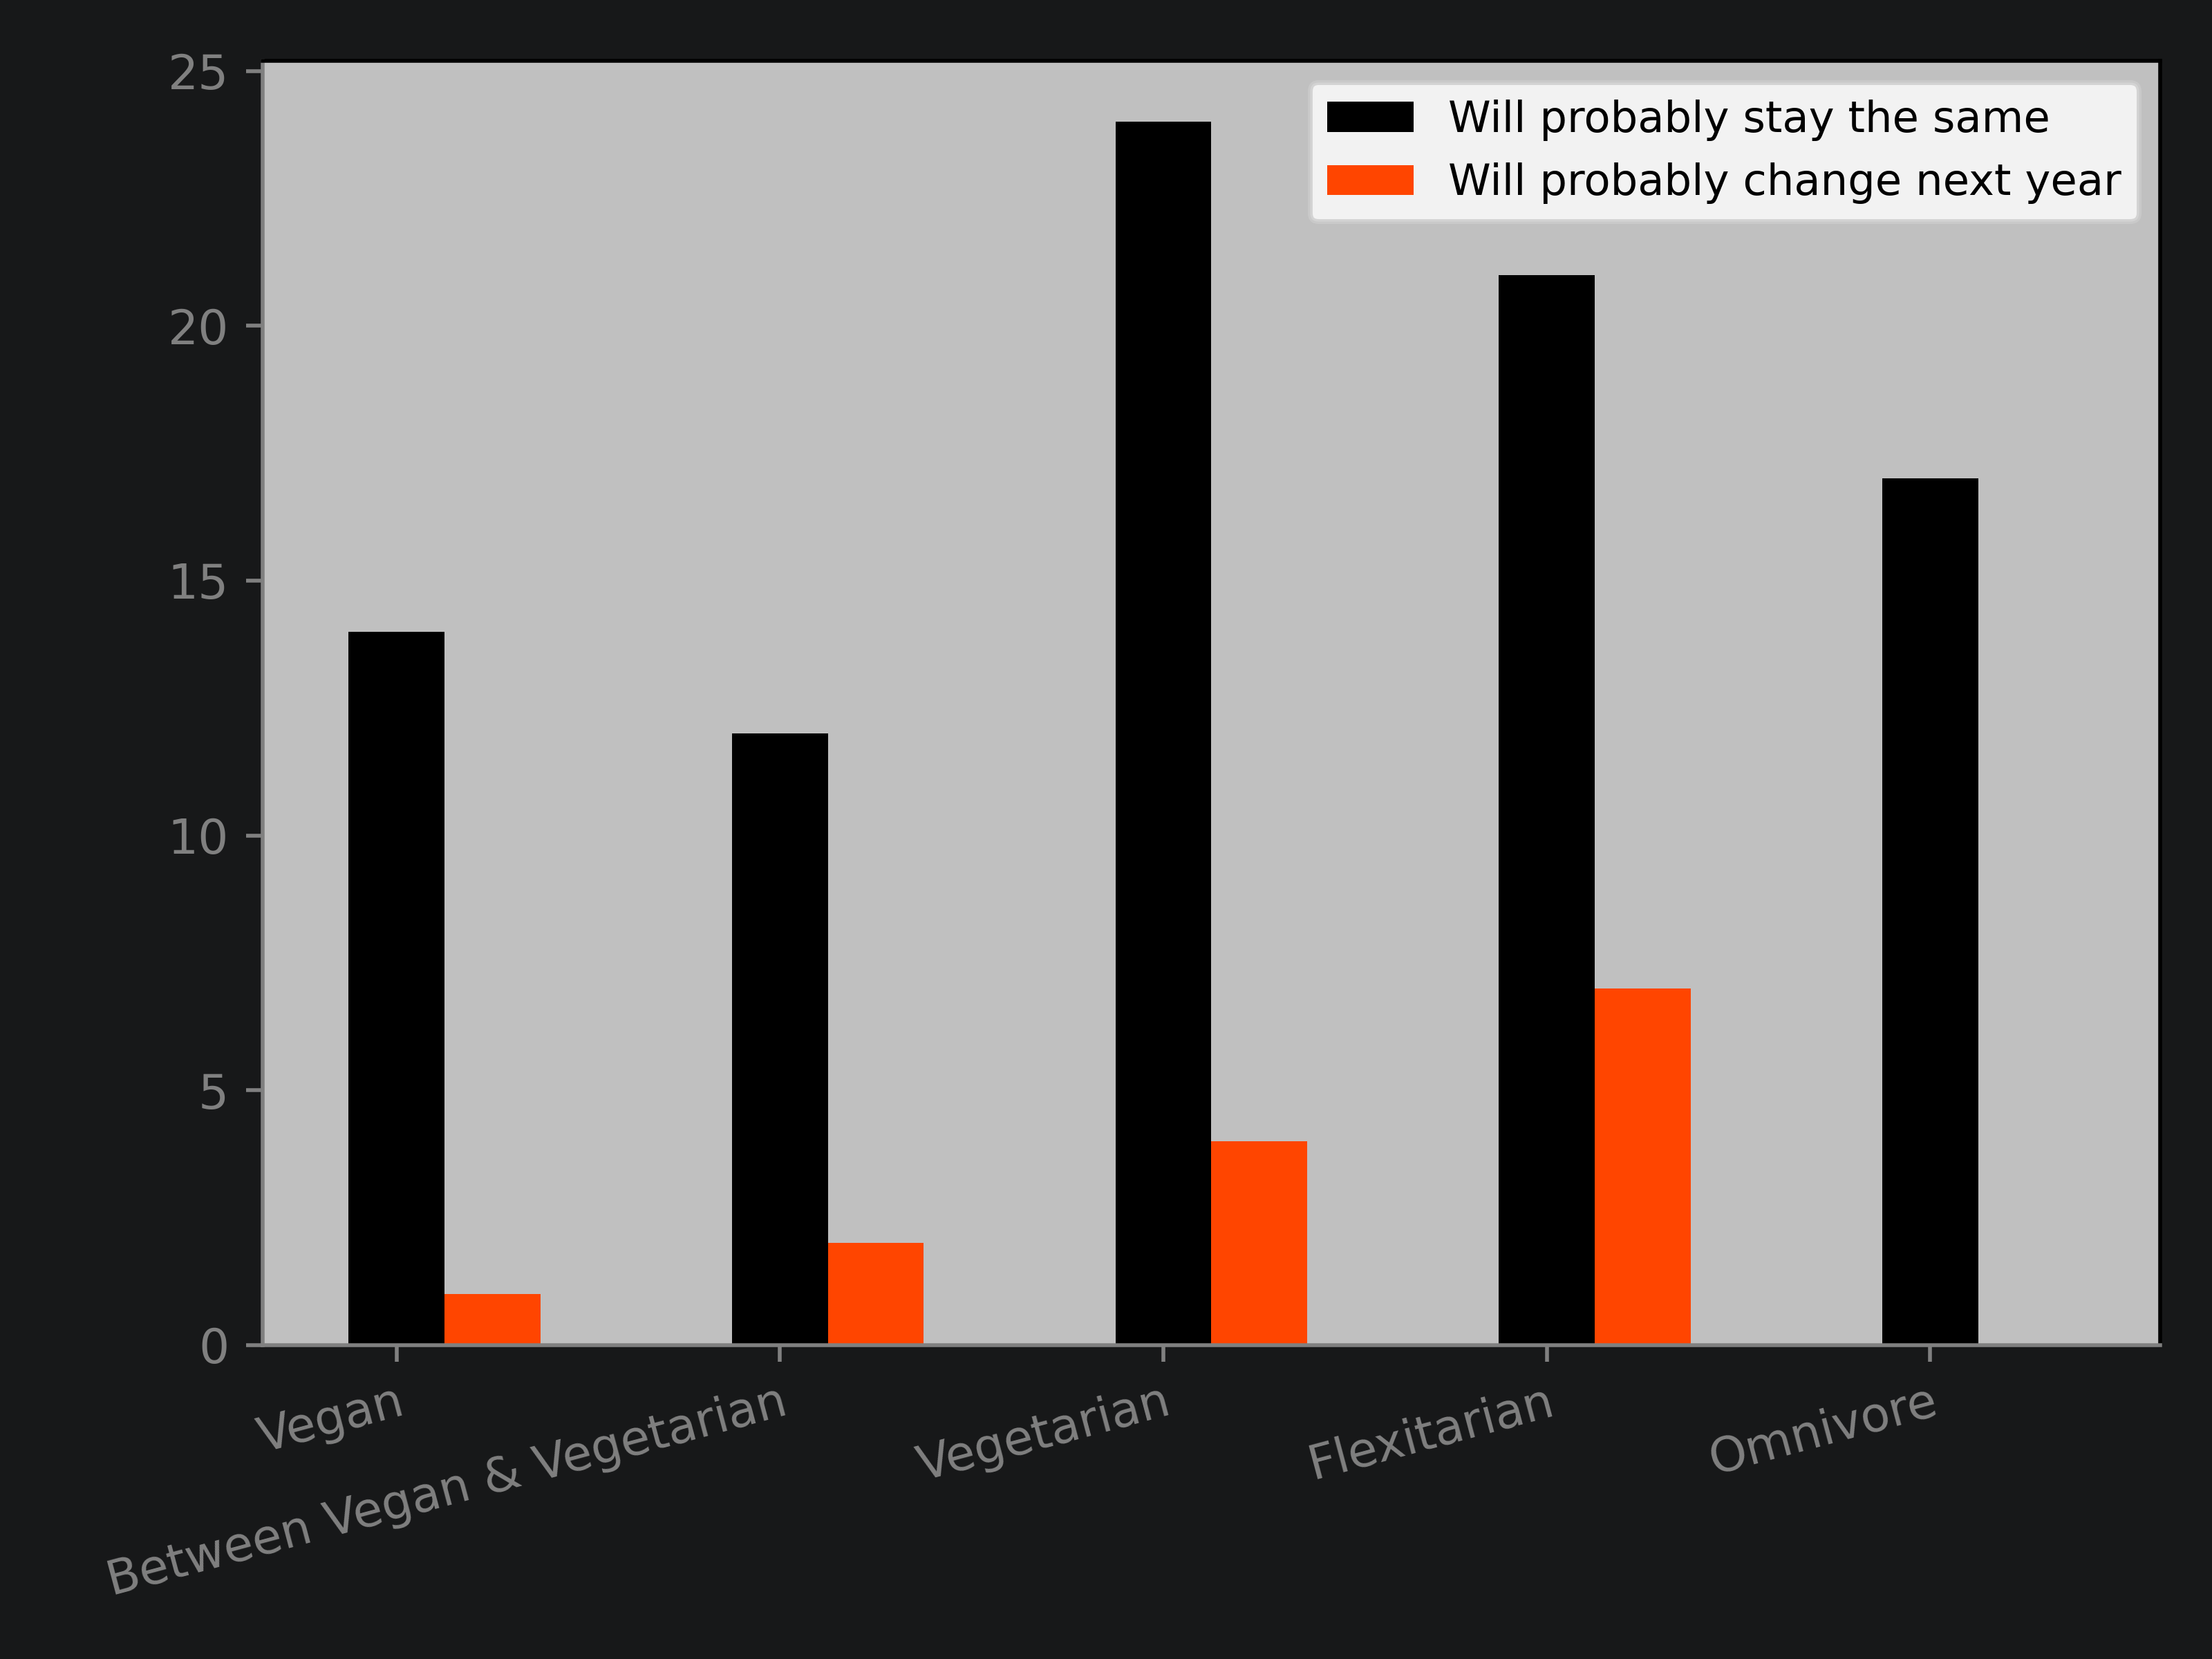
For week two, we had the suspicion that a lot of people on campus are consciously reducing their meat consumption /consumption of animal products. Thus, we wanted to know it a little more in detail. Turns out we were right! The majority of us do not consume meat, quite some people are even vegan or at least almost (the ones placing their dot on the line got their own category) and then there is a large group of flexitarians as well. Finally, isn't it interesting that some people will probably change their diets except for the very steadfast omnivores?!
TOILET DATA
Results of Week Three
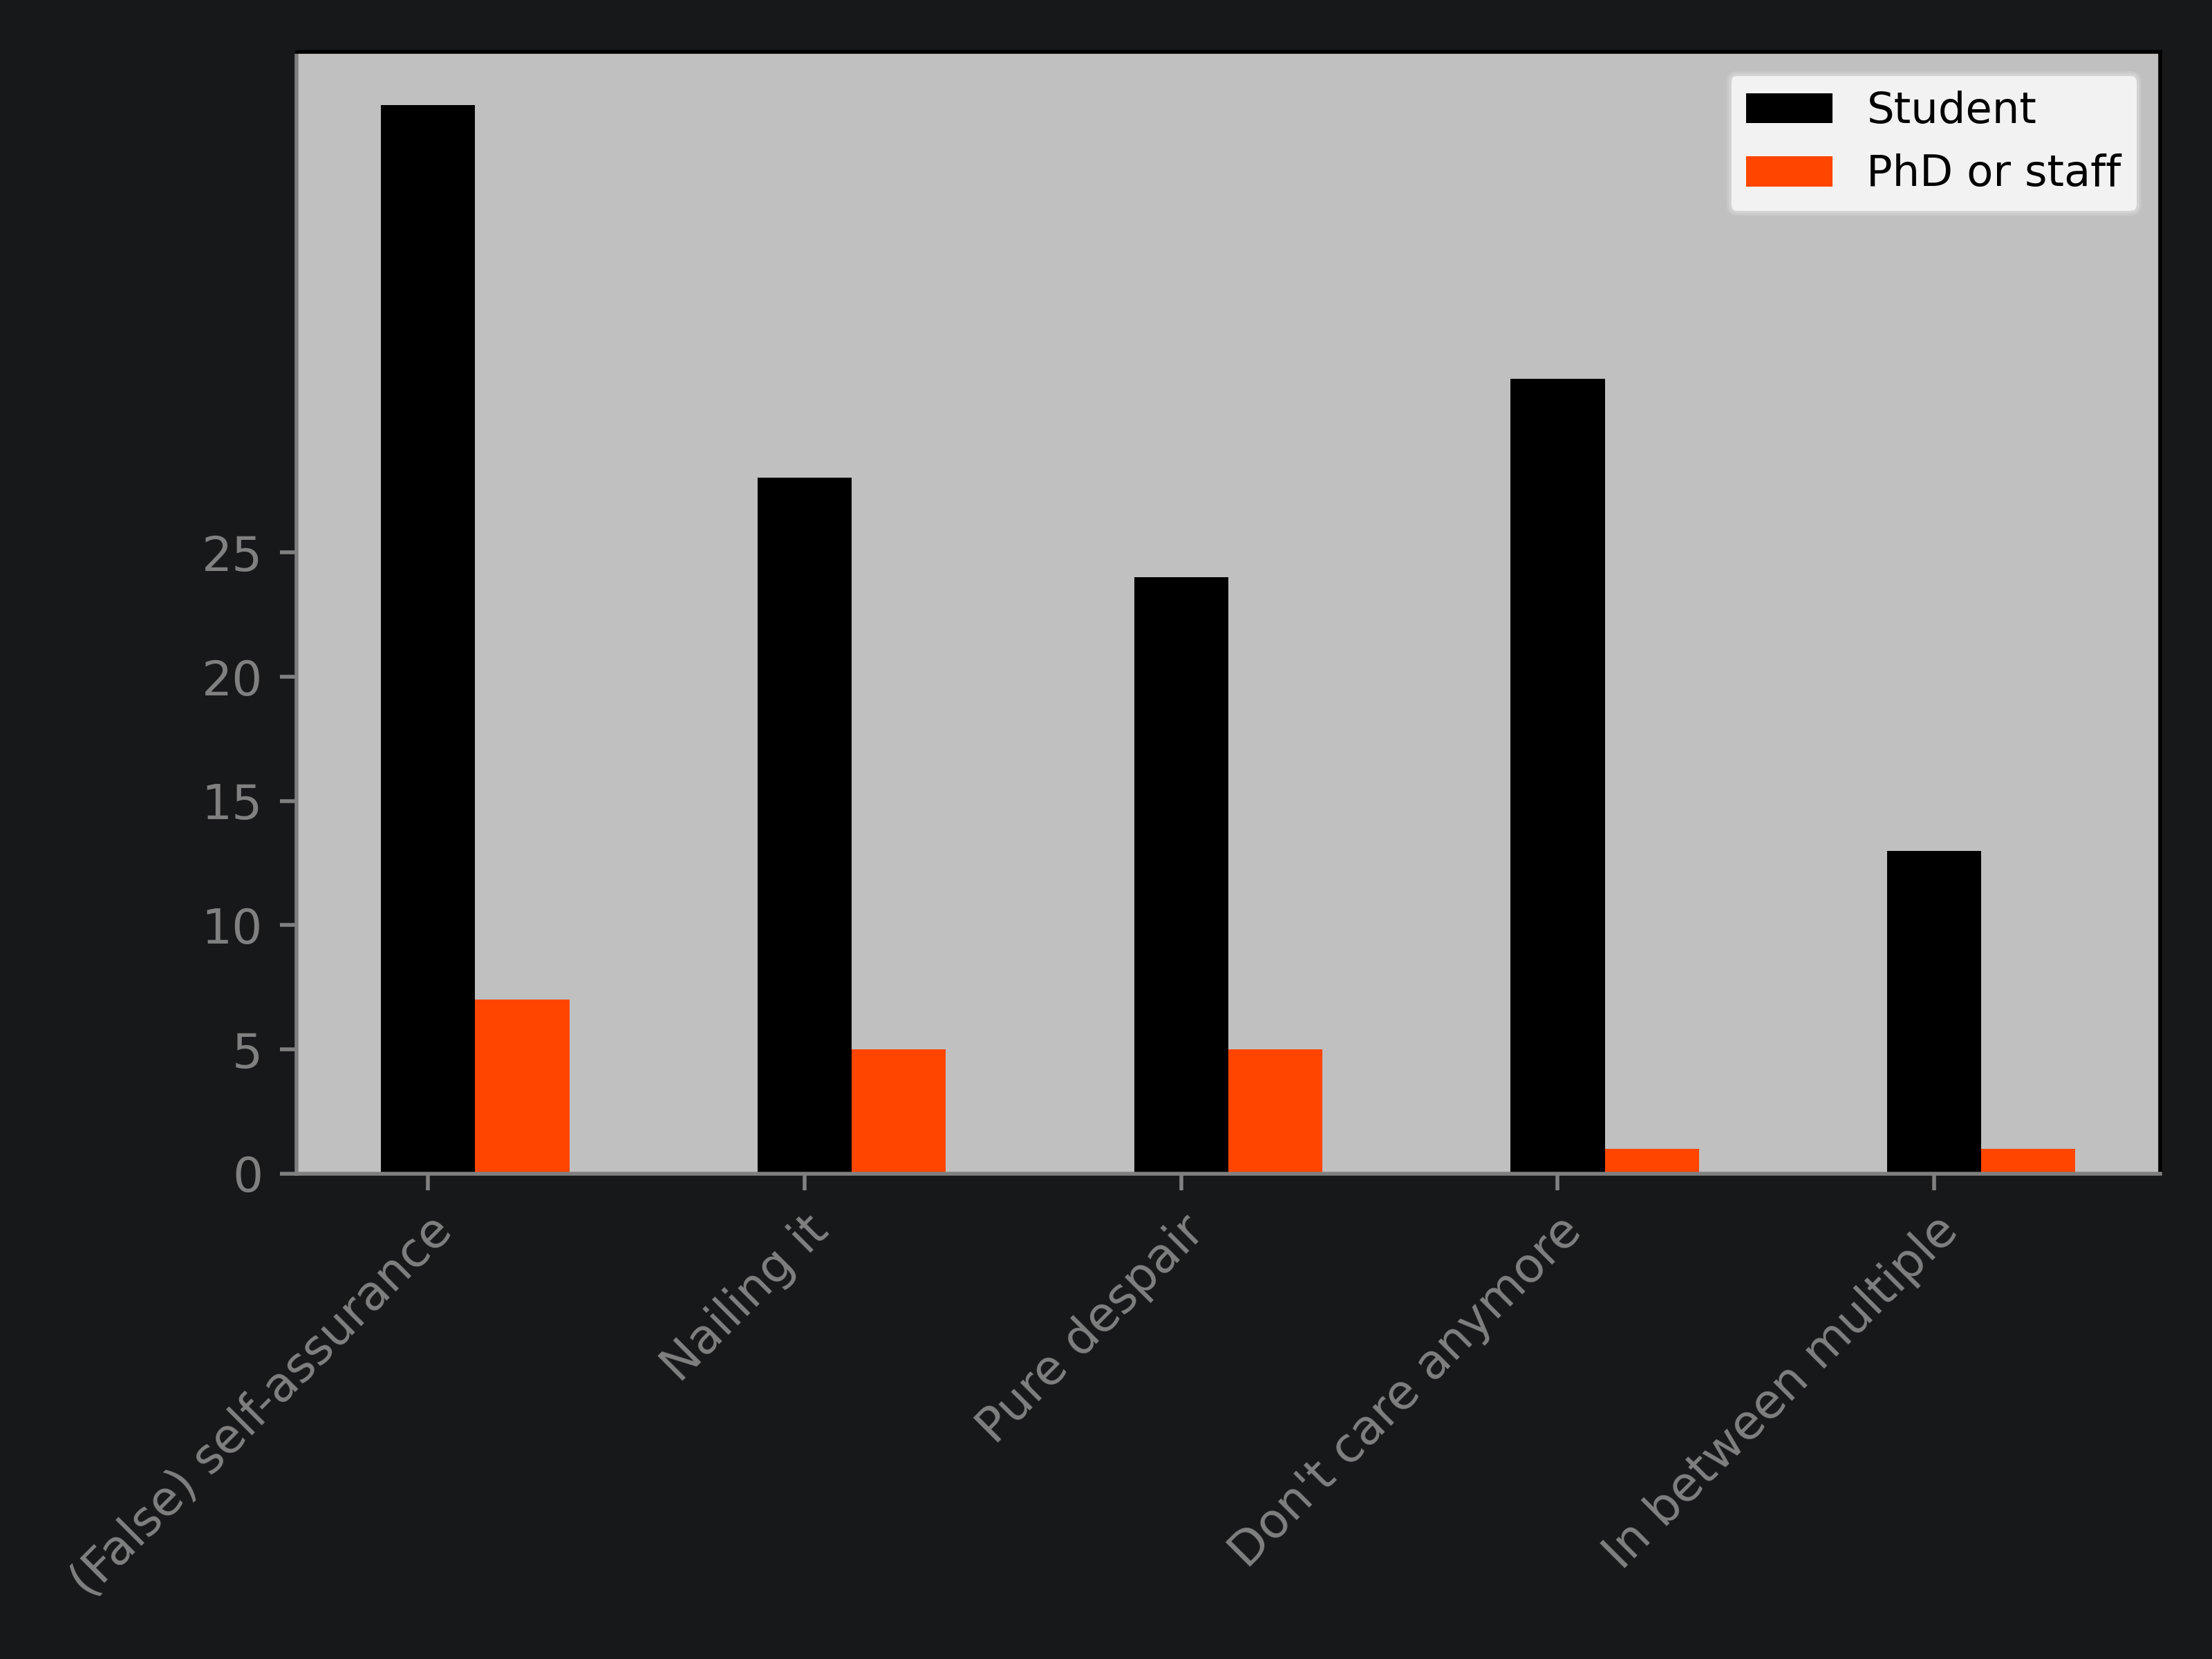
Week three was overshadowed by the last weeks of the term. Therefore, we wanted to give you the opportunity to tell everyone how you are coping with the deadlines. Unfortunately, not as many of us were 'nailing it'. Nevertheless, you guys are at least not in total despair yet...or at least that was the smallest category besides these rebels who had to put their labels on the line. In essence, the ones suffering mostly cope with it with an emotional rollercoaster, a careless attitude or positive self-assurance. Sounds like the campus is handling it somewhat well, right? Don't forget to reach out to friends and family or professionals but be reminded for next time that the final week is only a week!!
PS: hardly any member of staff/PhD student doesn't care anymore - we love your passion, keep it up!
TOILET DATA
Results of Week Four
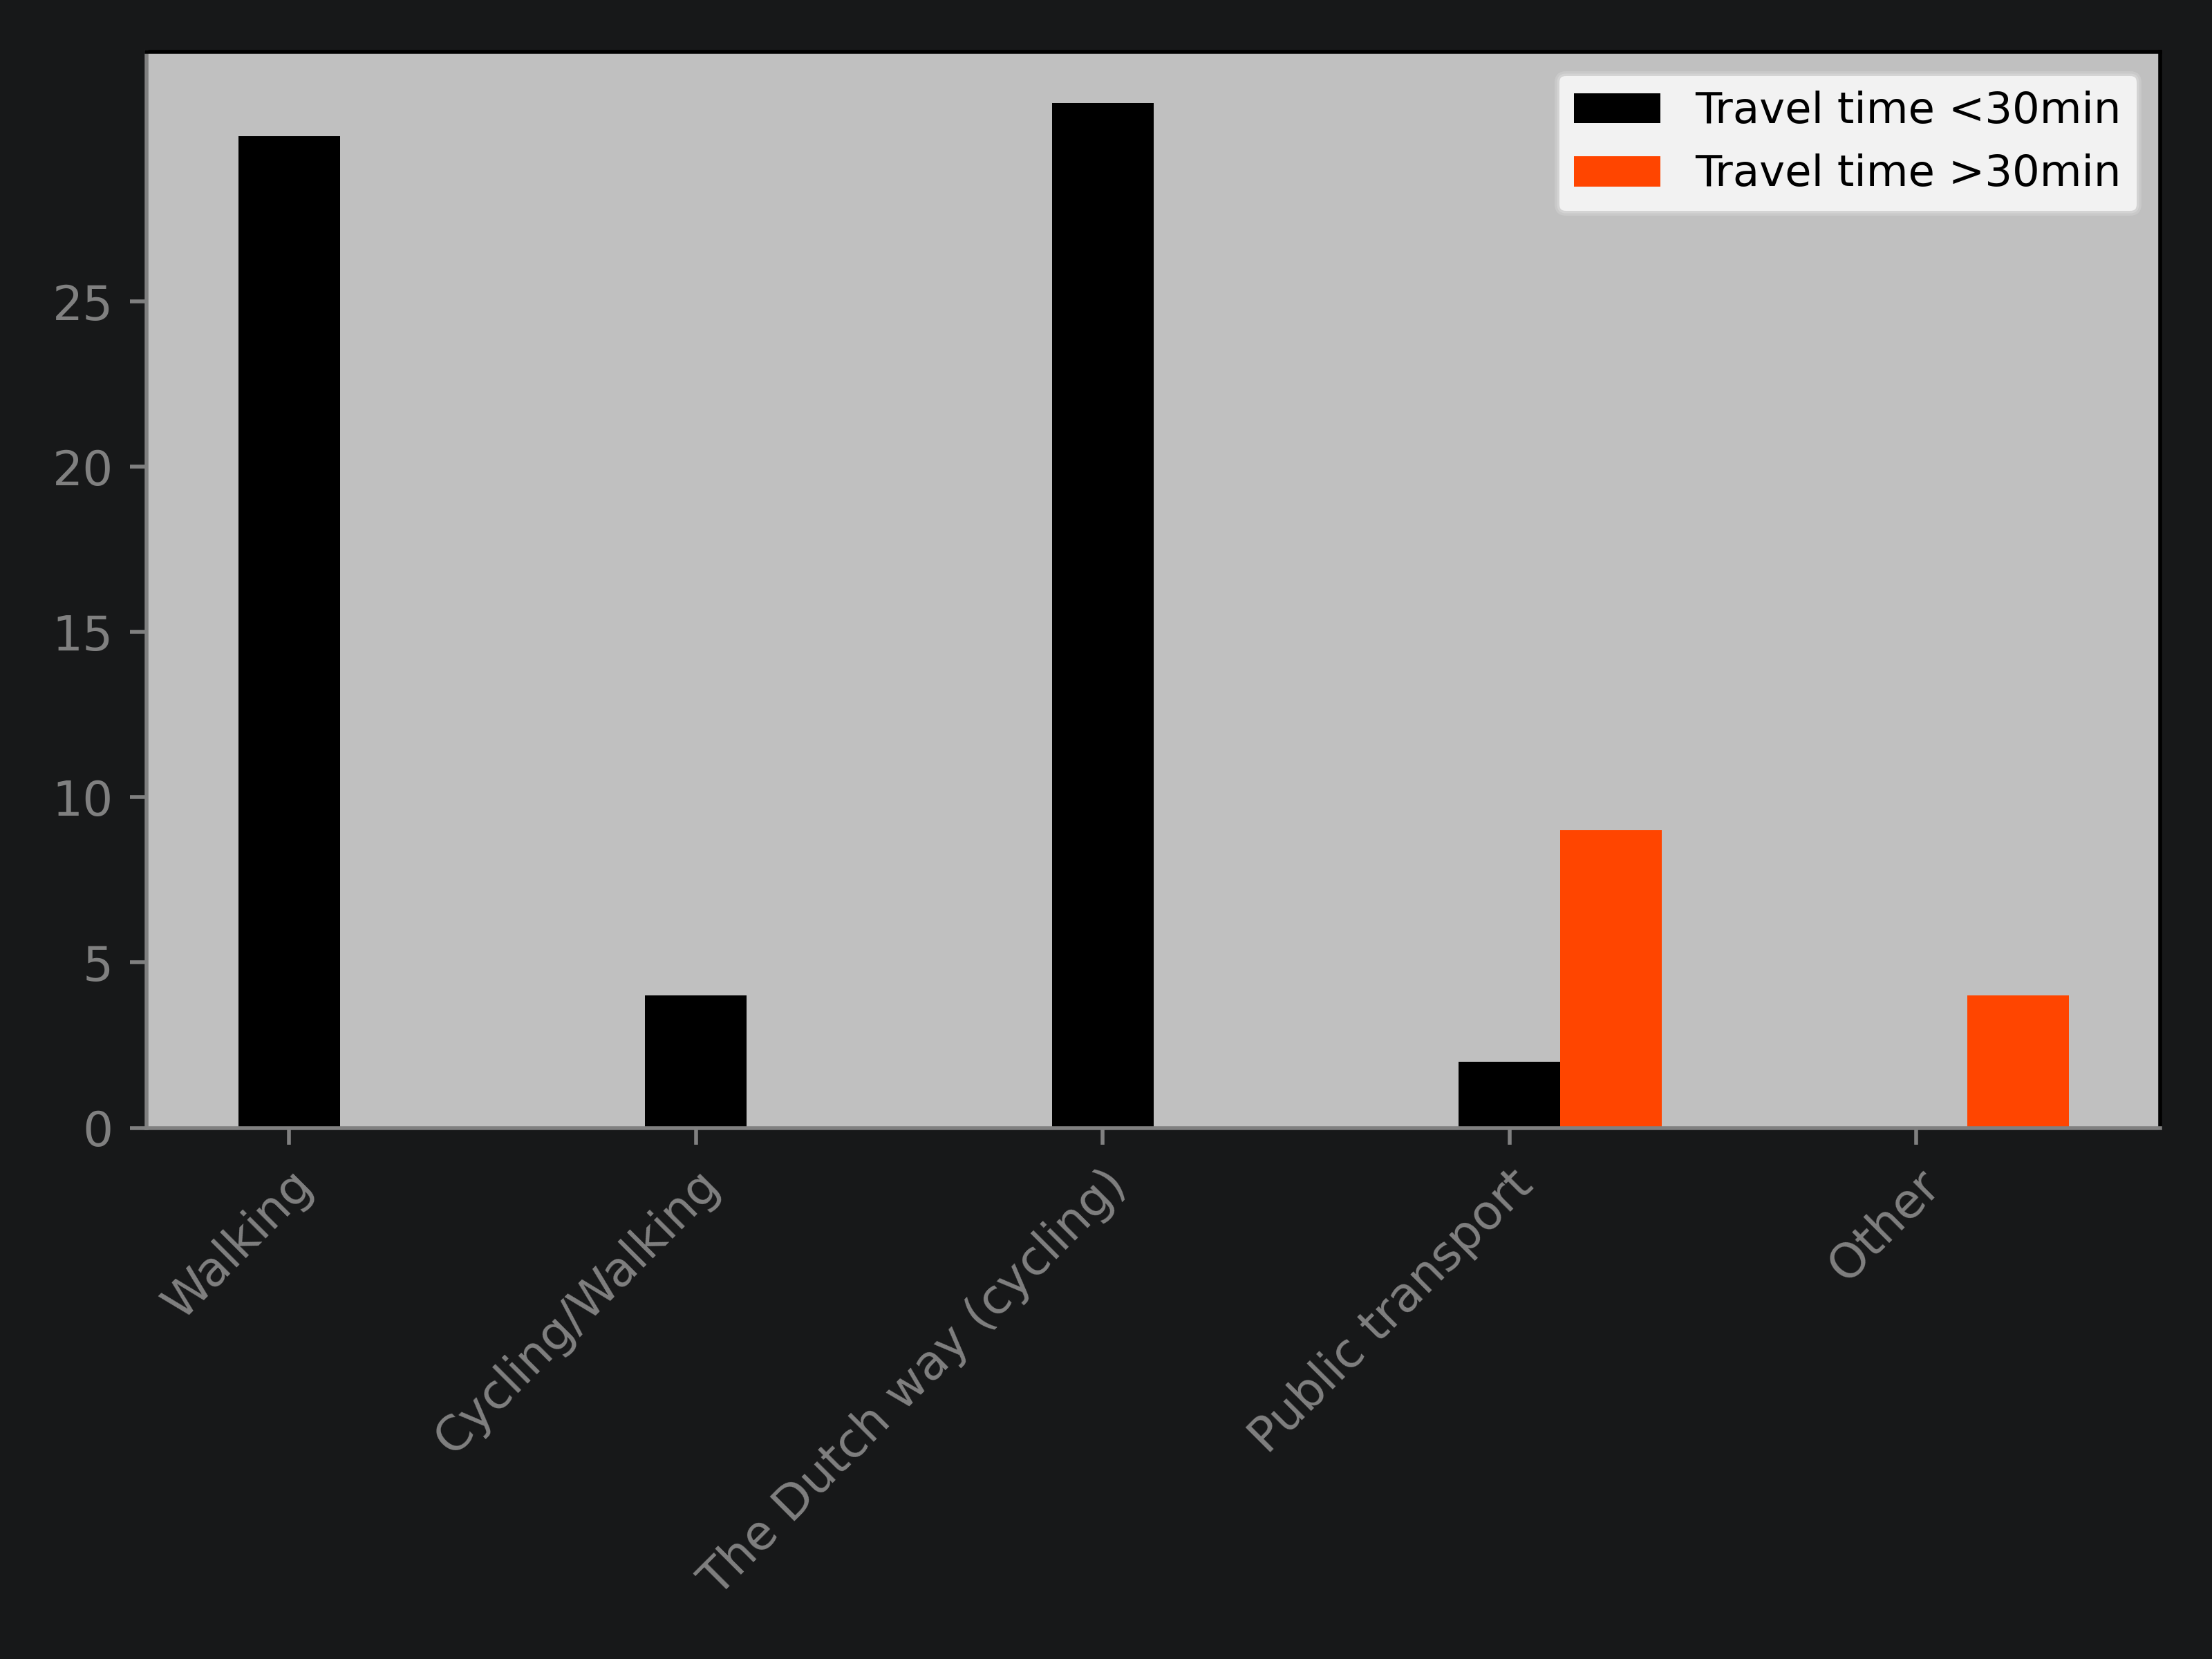
How do you get to your favourite university building (which is of course lovely the Beurs) was the question for week 4. Most of us either walk or cycle (or a mixture of both), which is not very surprising given the size of Leeuwarden. Only the people who travel for more than half an hour tend to take the public transport or other modes of transportation. Great to see that the faculty lives up to its sustainable standards - only very few travel by car apparently!
TOILET DATA
Results of Week Five
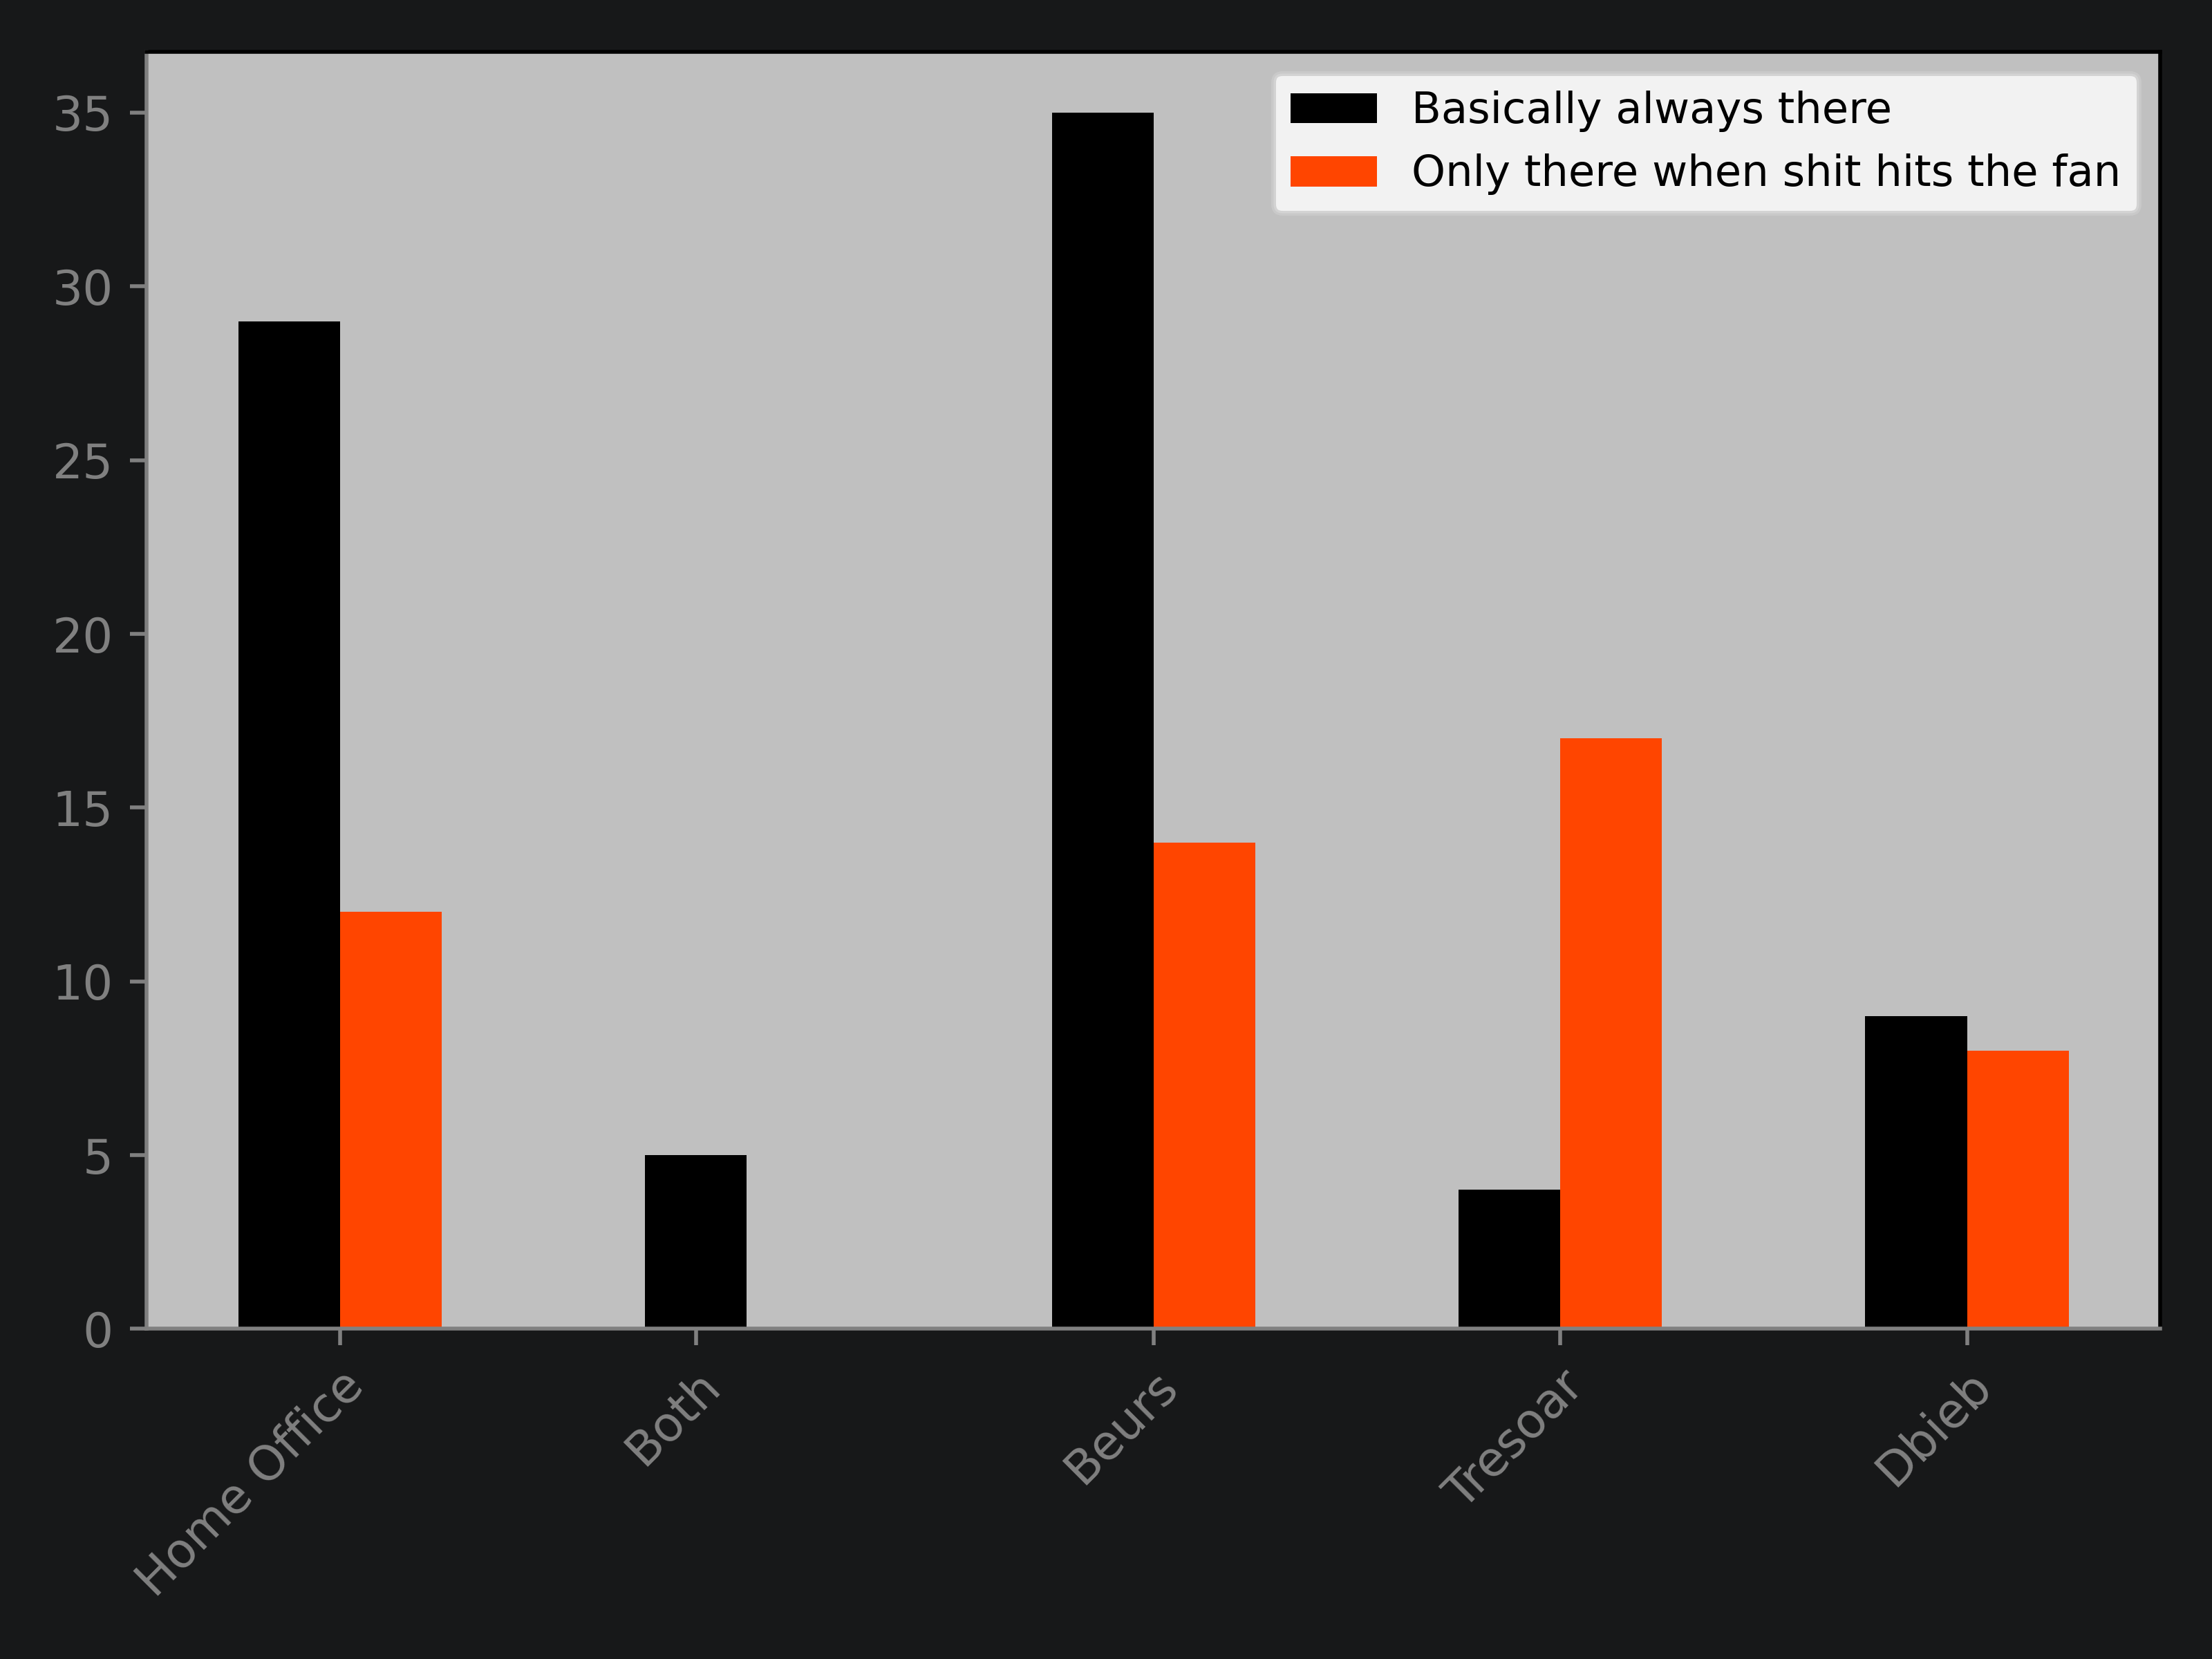
Steering towards the final weeks of the academic year (already?!), we are interested in your favourite study spots. That includes whether you're a regualar there or only seen when "shit hits the fan". Apparently, we seem to love our building and homes at any time! I assume that is a good sign for both environments. Interestingly, the libraries in Leeuwarden become increasingly attractive in desperate times when we need our full concentration. Are there too much distractions at home and too many people to procrastinate with at uni?
TOILET DATA
Results of Week Six
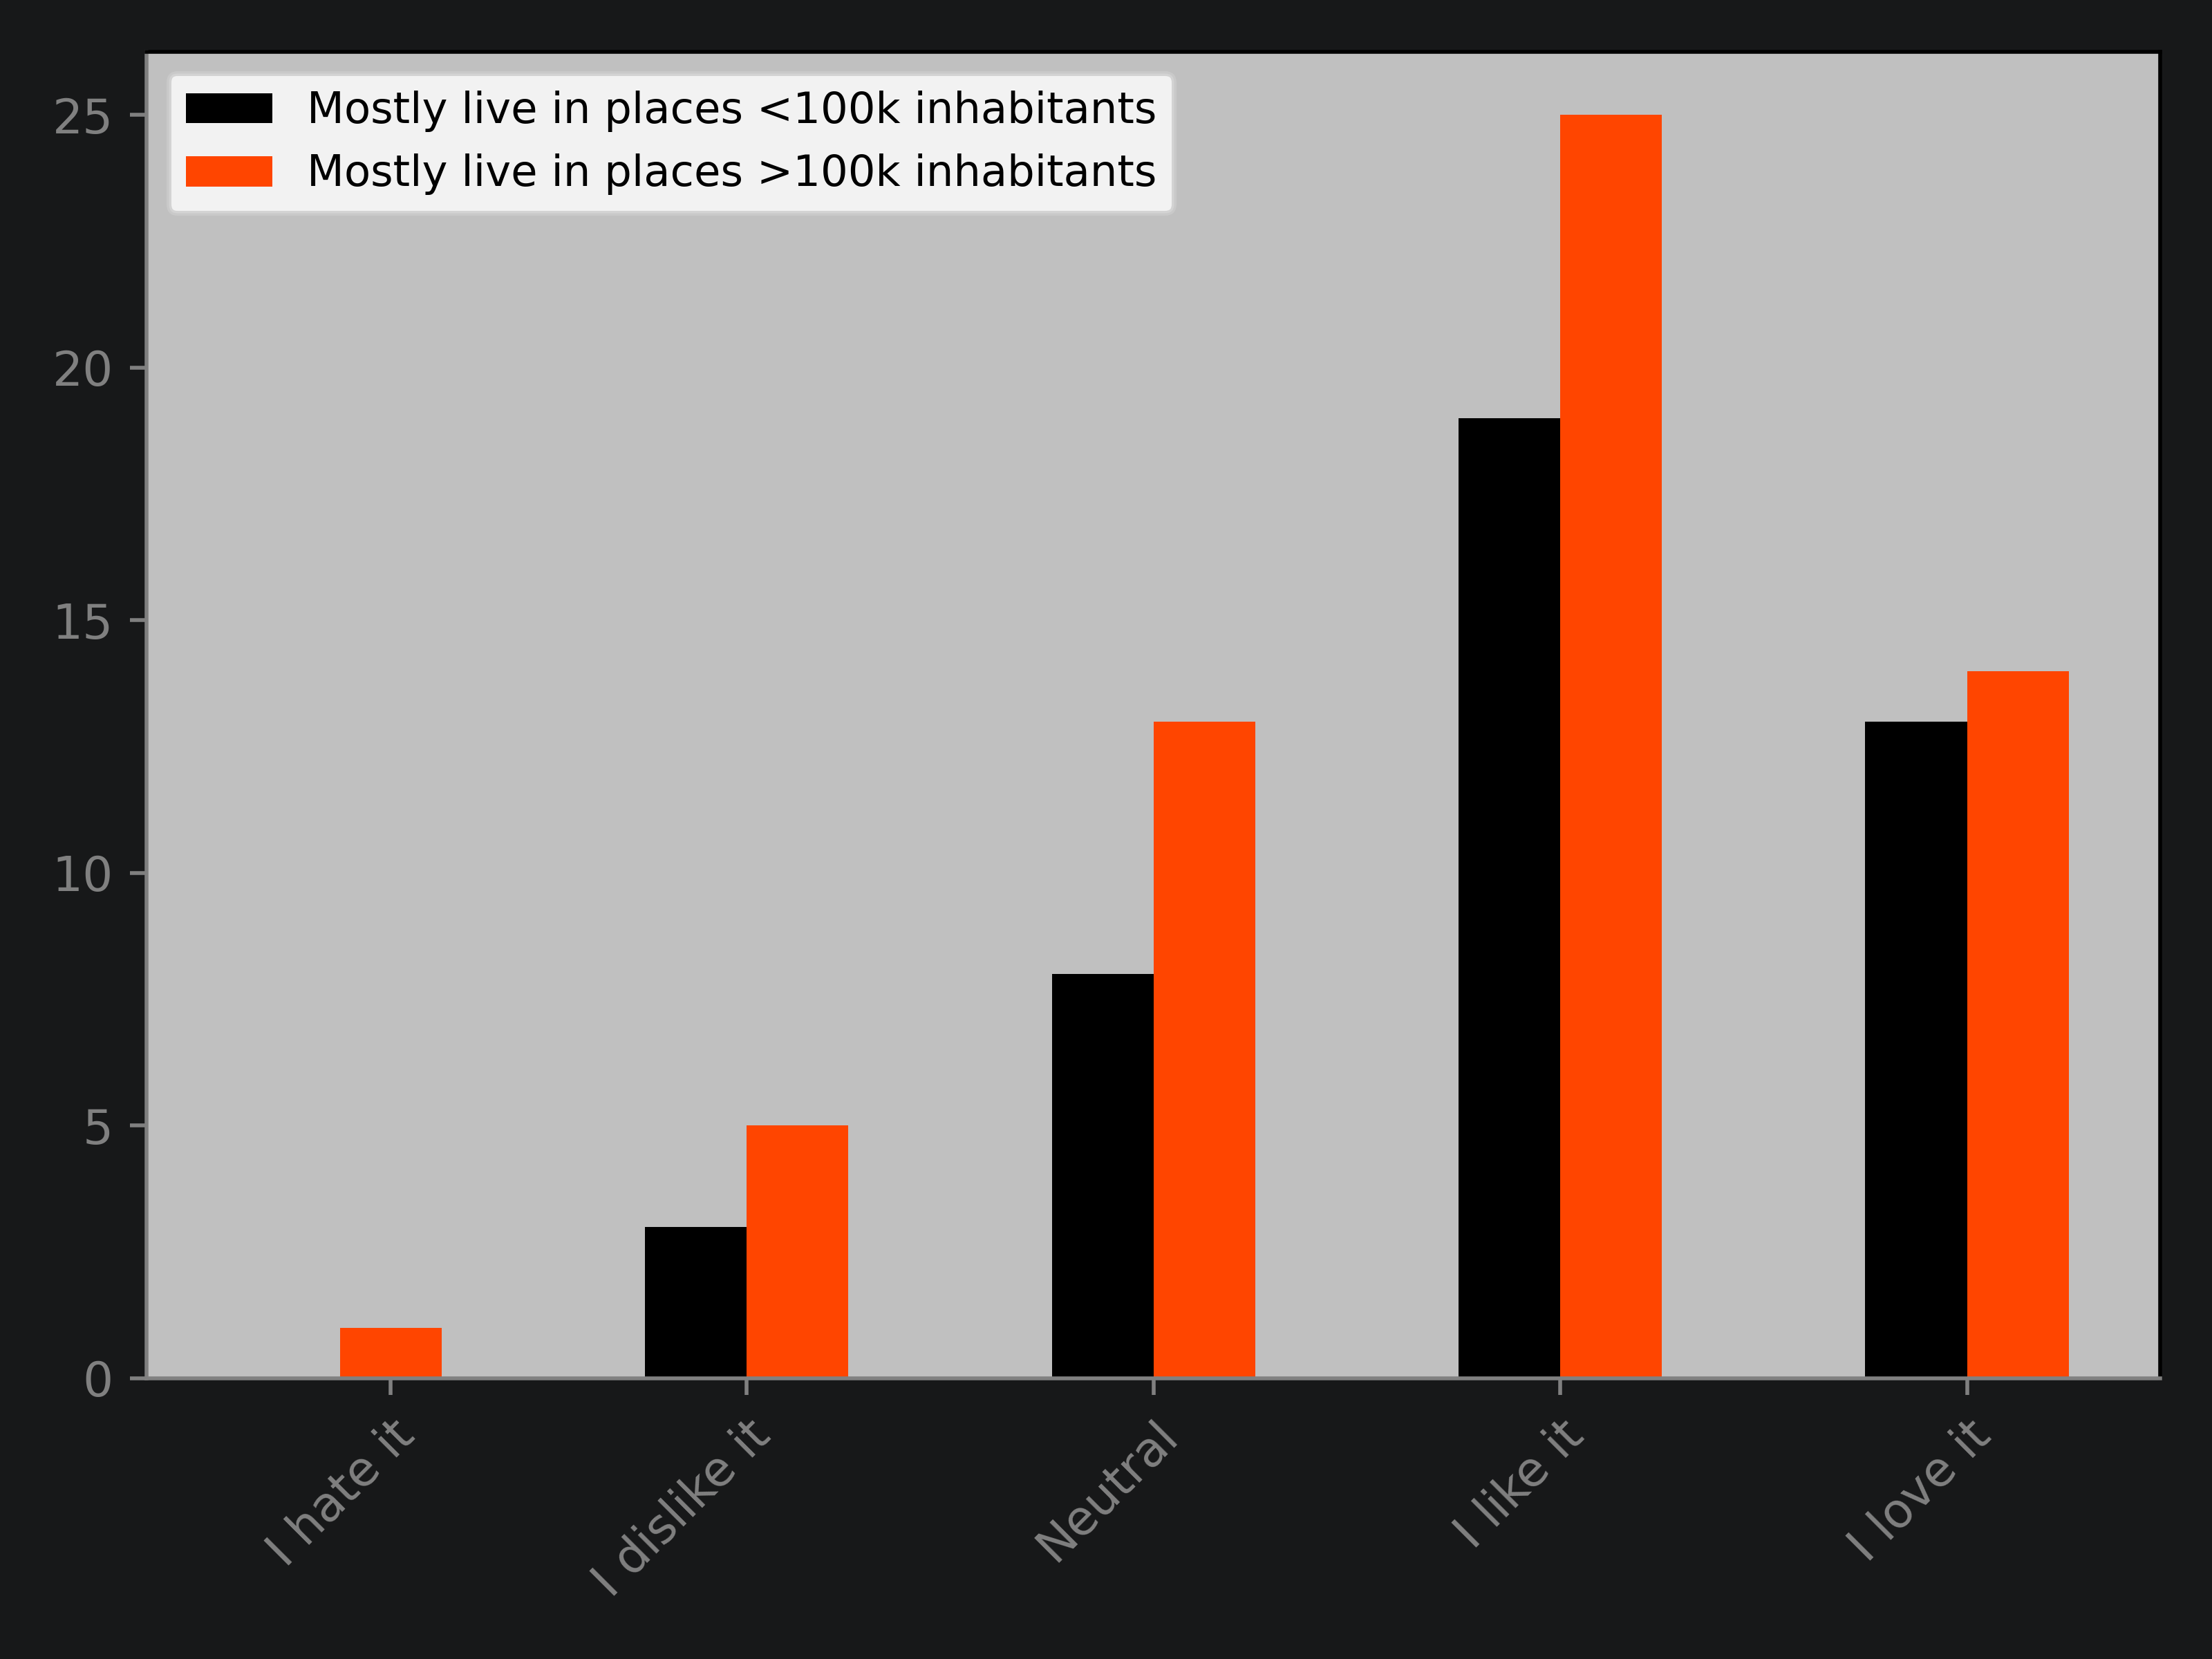
Leeuwarden was of interest in week 6 of the bathroom data! More specifically, we wanted to give you an opportunity to express your love or hate for the city. The results seem to indicate much more love than hate for the city with a majority at least liking the city. Contrary to our expections even the big city kids like it around here! We thought Leeuwarden's cuteness is an asset but the lack of happenings may be a downside compared to the standards of (other) bigger cities. We are glad you like it around here and feel sorry for the few that don't! Hopefully you surround yourself with some nice people to enjoy your time here despite Leeuwarden!
TOILET DATA
Results of Week Seven
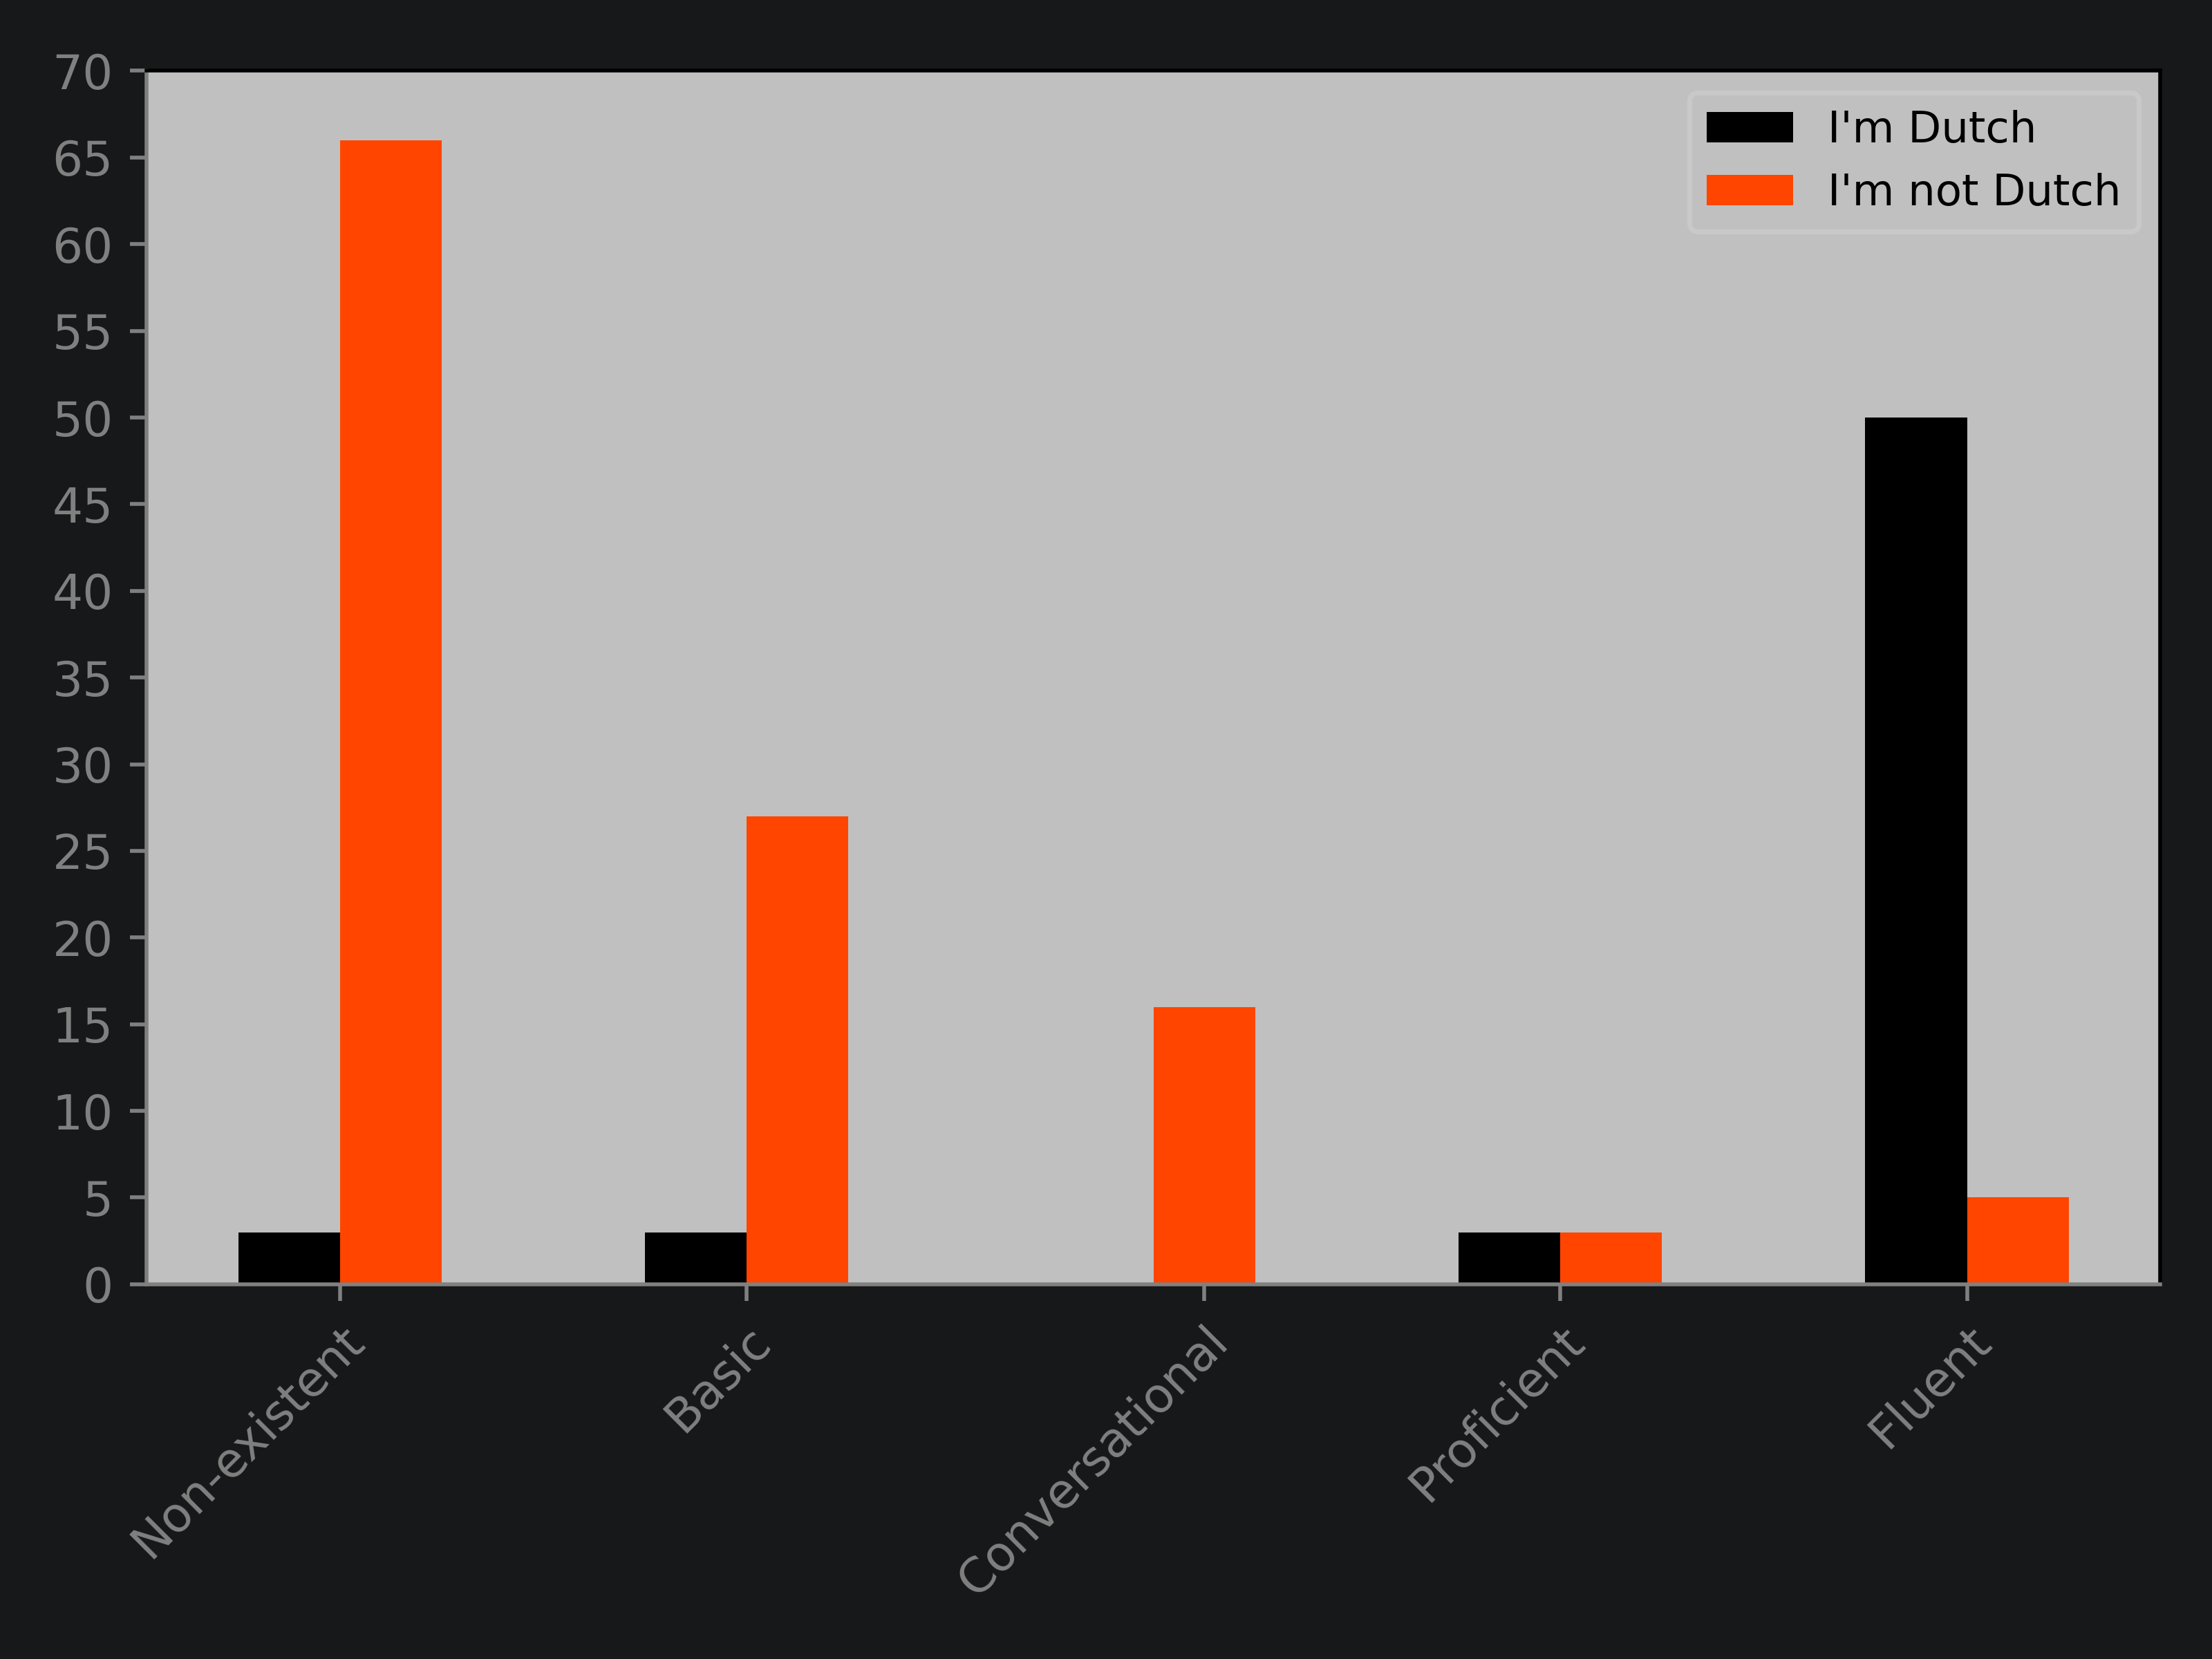
We are quite international (non-Dutch) and the main language on campus is of course English. So, that leads us to ask how many of us actually speak Dutch. Apparently, not that many of the internationals go beyond the very basic level which is not that surprising given the environment. What is actually surprising is the number of Dutch people who barely speak Dutch...that provokes the question what being Dutch even means...or is this a joke?? I guess we will never know.
TOILET DATA
Results of Week Eight
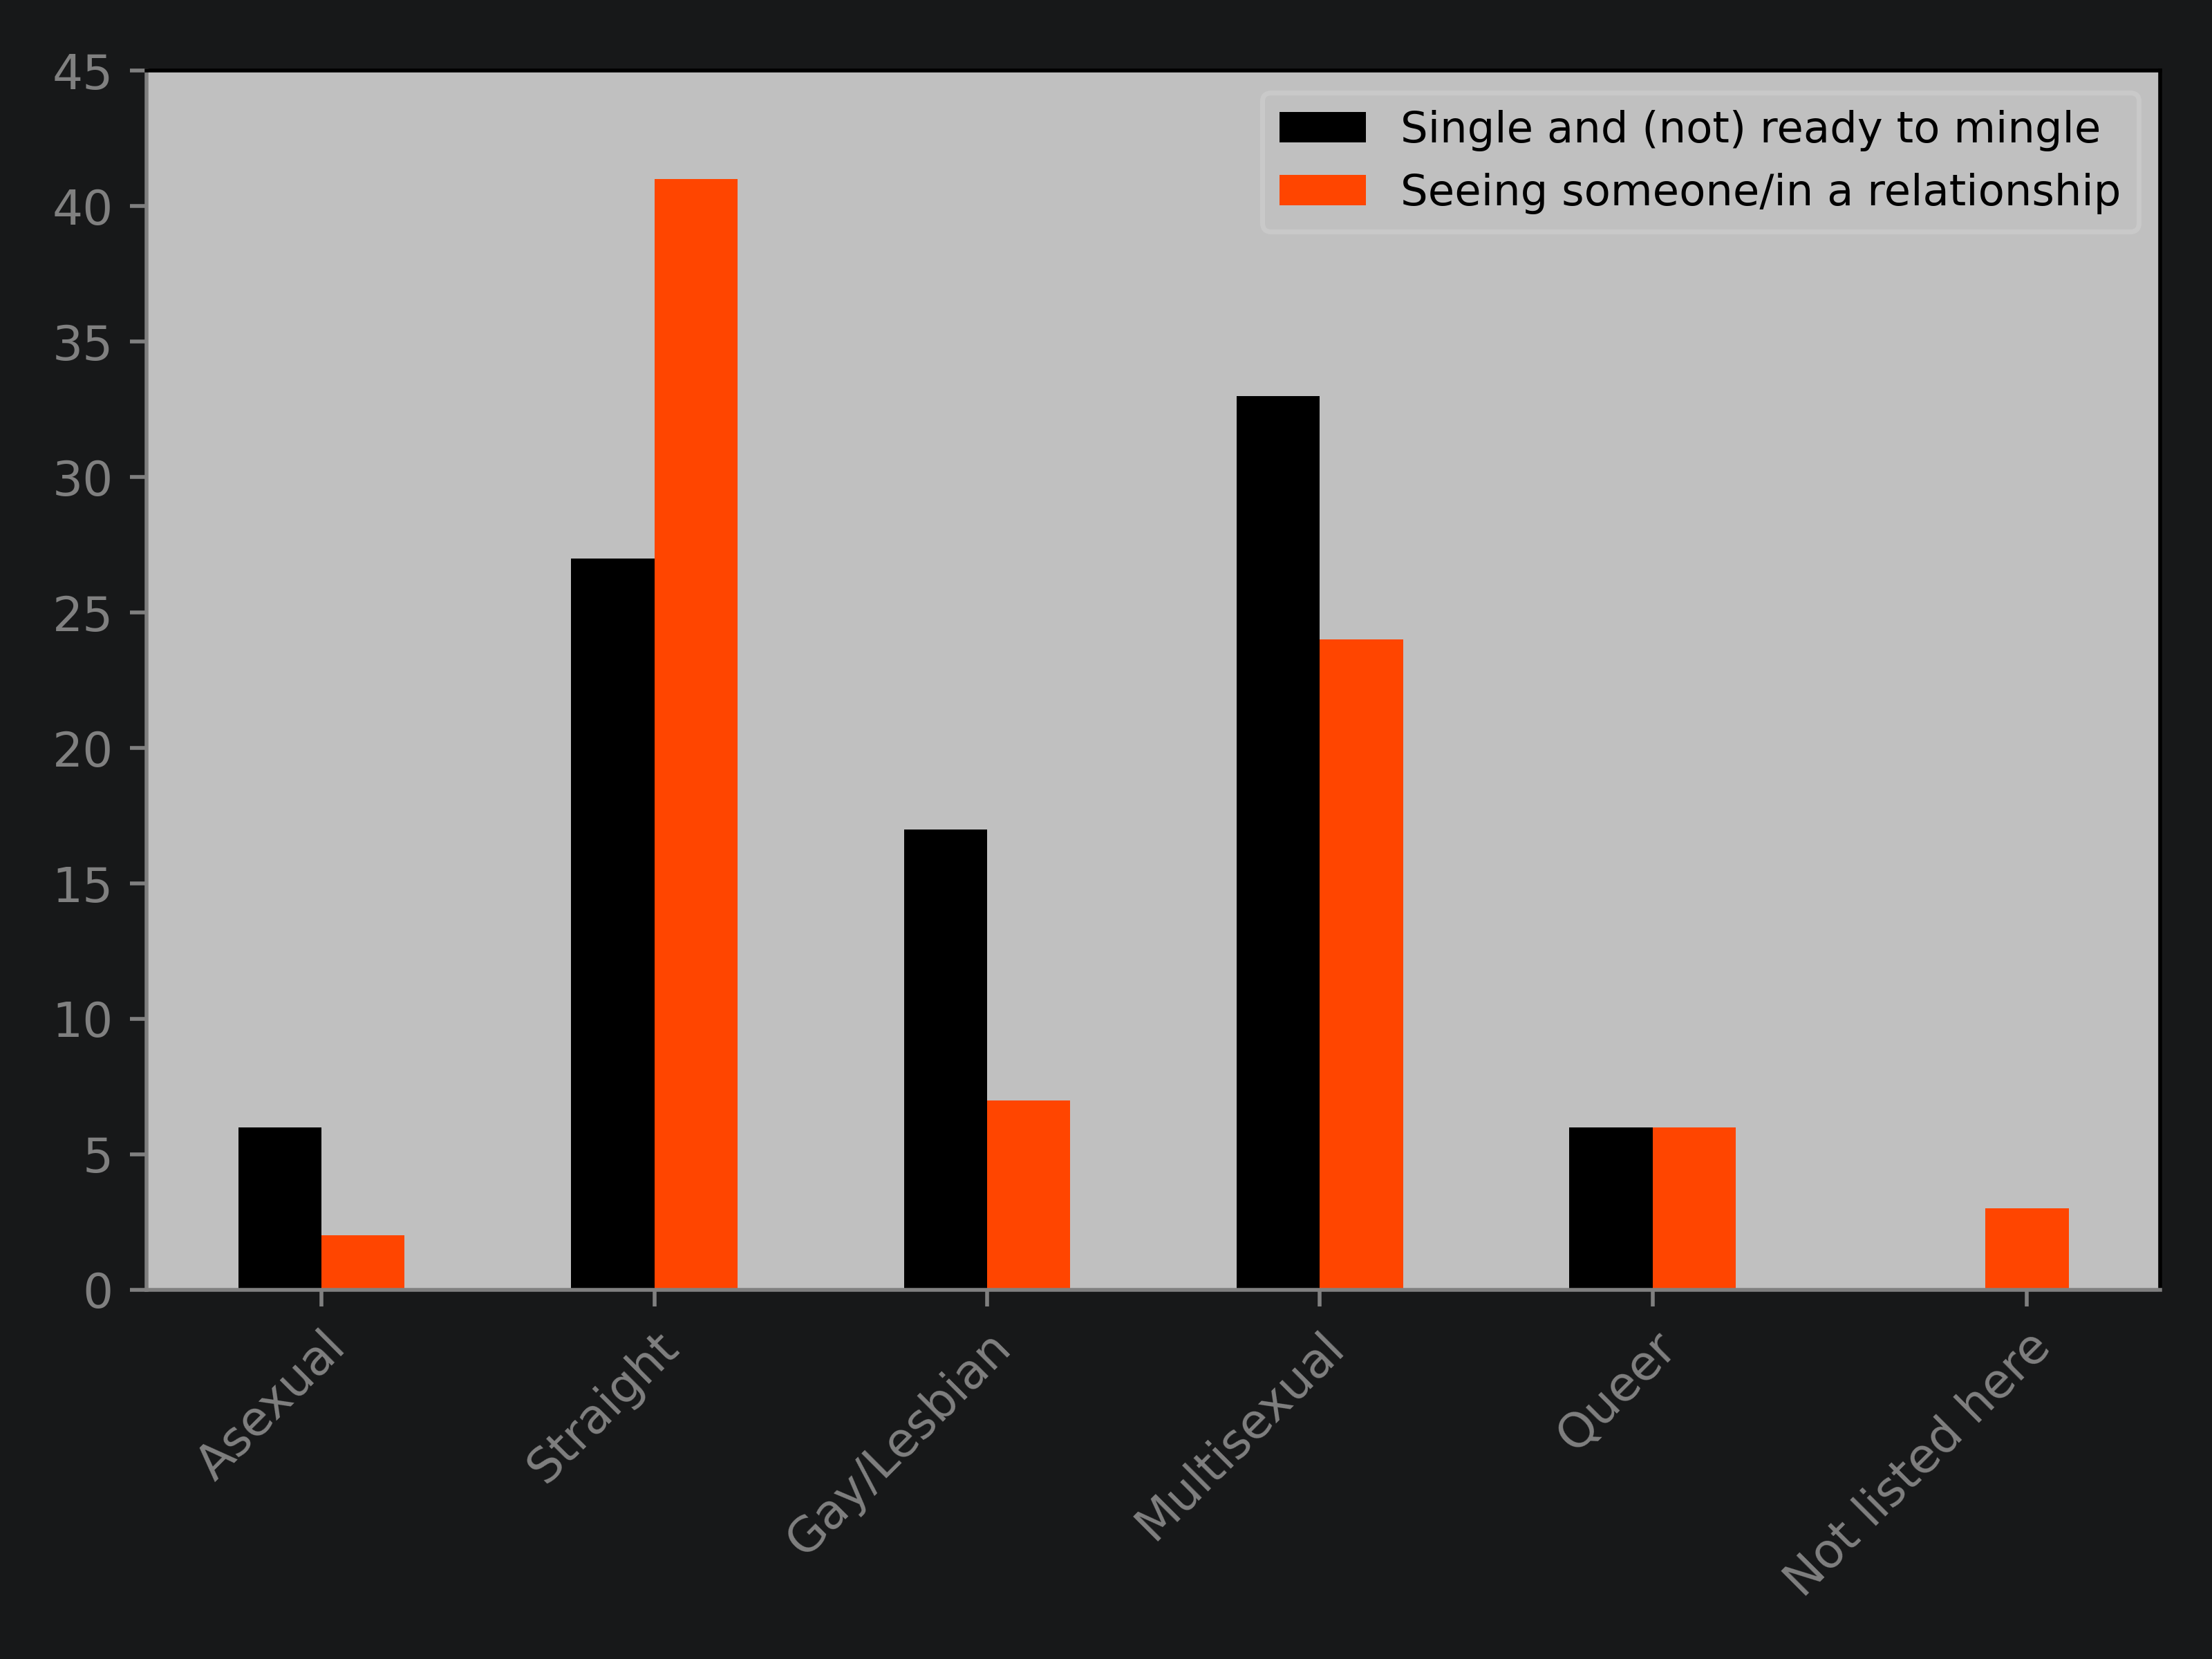
Pride month is there! We want to hear who you are interested in!! We had the suspicion that our campus is a little more diverse than the average population and based on the reults we think that this can be confirmed. The biggest group are the mostly straight people still but only by a rather small margin. Interestingly, that's also the only group with more people in committed relationships (at least the only one where both sides are present in the data). I wonder whether that's an actual trend or just randomness. Other than that the results speak for themselves. PS: as far as we are concerned: we love everyone our community!!
PS: as far as we are concerned: we love everyone our community!!